

Would you rather have more free time or more stuff?
Would you rather have more free time or more stuff?
And when do workers have a choice?

If a shorter workweek is possible in theory, could it be the case that Americans just like working long hours, or at least earning more money?

Recent polls suggest that Americans might actually prefer a 35 hour week, or even a 4-day workweek. Why don’t the numbers show us moving closer to this ideal?
If we look back at history we see that the biggest drop in working hours coincided with times when when workers had a lot of bargaining power. Have there been any other periods since then when workers had a similarly good position but hours stayed the same or increased?
One way we can measure the overall bargaining power of workers is by taking a look at the difference between the growth in labor productivity and wages.
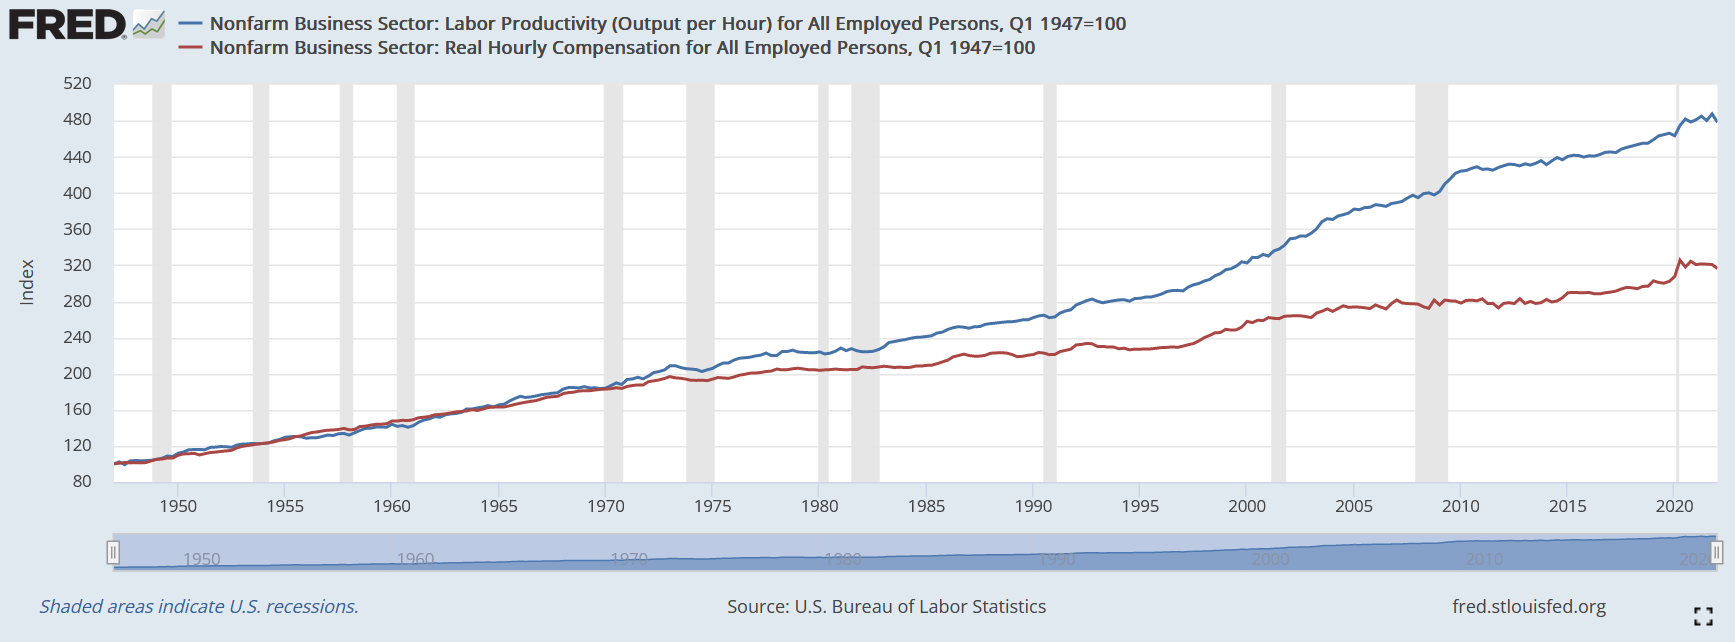
We can see what the difference was (shaded area) for each year here:
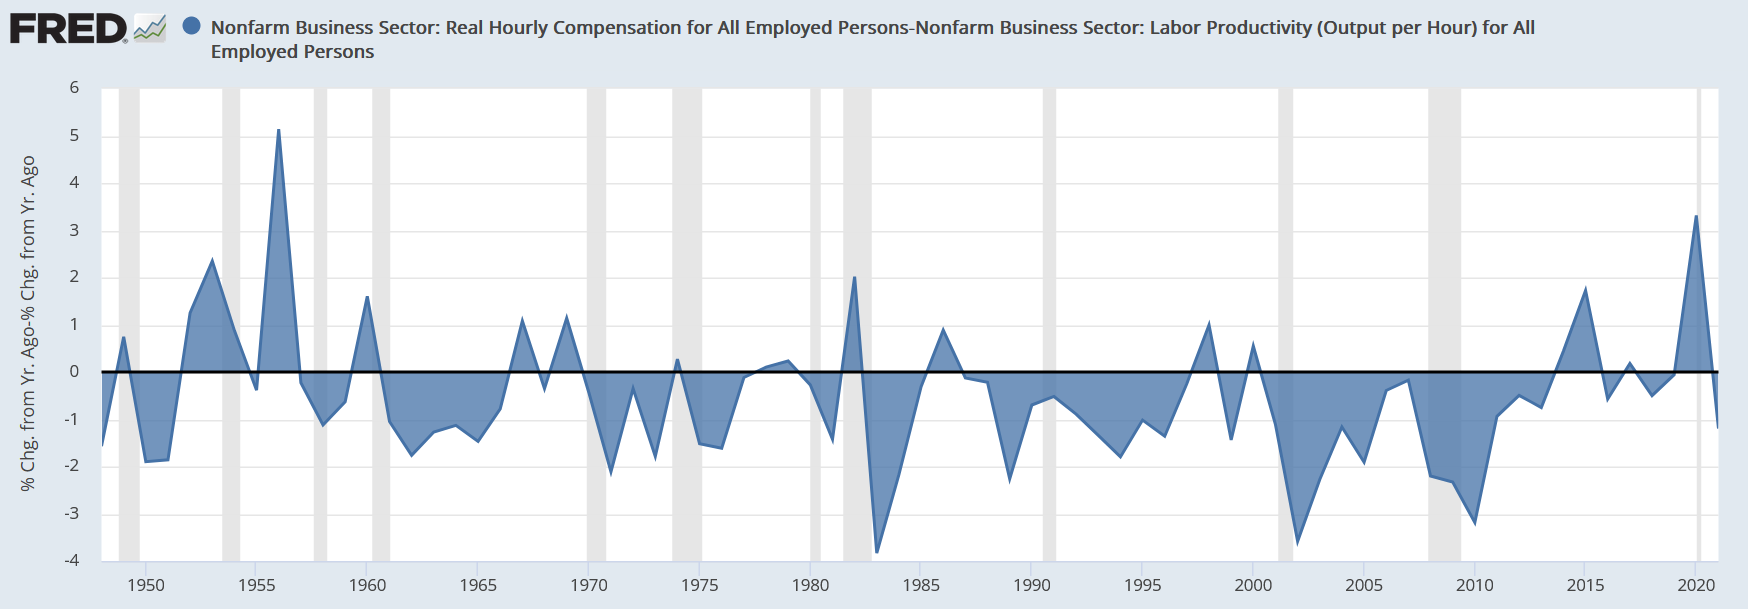
Essentially, when the shaded area is above zero, it means that workers on the whole were able to negotiate per-hour wages exceeding their productivity. But most years between 1970 and the mid-2010s saw the opposite— workers losing ground and likely unable to negotiate whatever their preferred workweek might be. The 1950s were the only decade that saw a clear net positive for workers, though the 1940s, 1960s, and 2010s come close. What can we learn from each of these decades?
The workweek in the 1940s
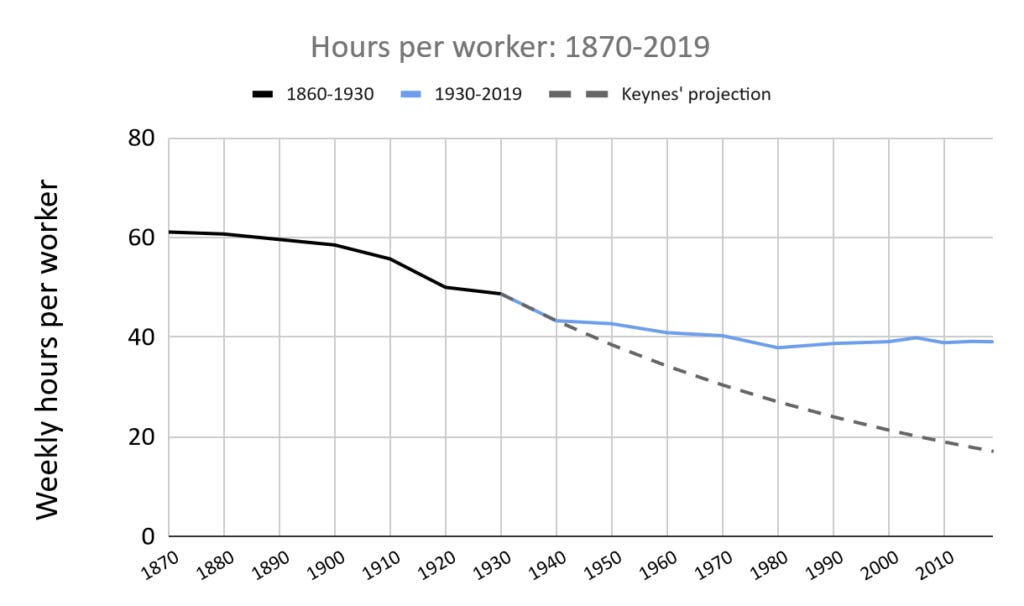
The 1940s of course saw an event that would have been hard for Keynes to foresee in his prediction of a shorter workweek— the massive mobilization required to fight World War II. As one might imagine, hours got somewhat longer, up to 46.9 from 42.5, at least for men. And many more women started working outside the home— the proportion of women in the labor force increased by about 25% during the war years. But even 5 years after the war ended, the workweek overall was hardly over 30 minutes shorter than it had been in 1940 despite continued improvements in productivity. Were people choosing to keep their hours the same so they could consume more?
This looks to be true of the late 1940s. If we look at data from the Consumer Expenditure Survey, we see a notable increase first in food, then in transportation spending (mostly car-related).
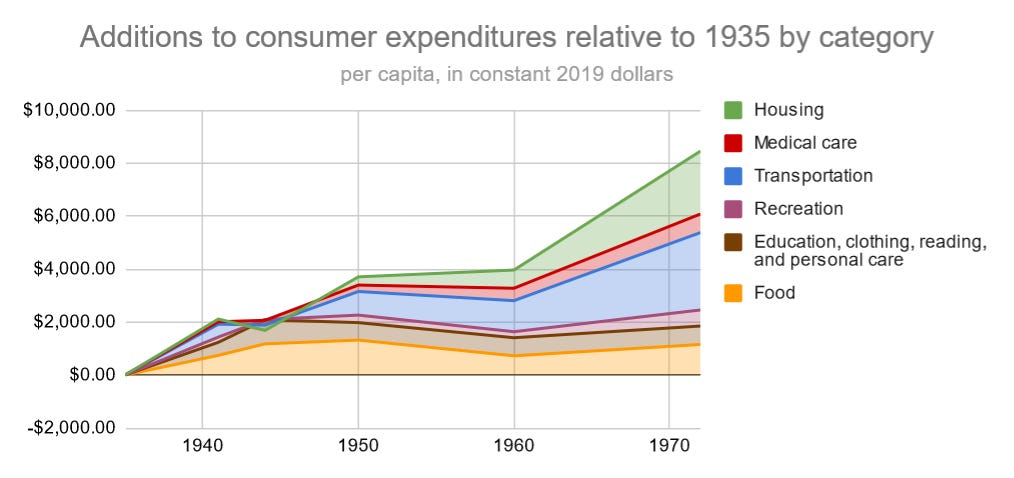
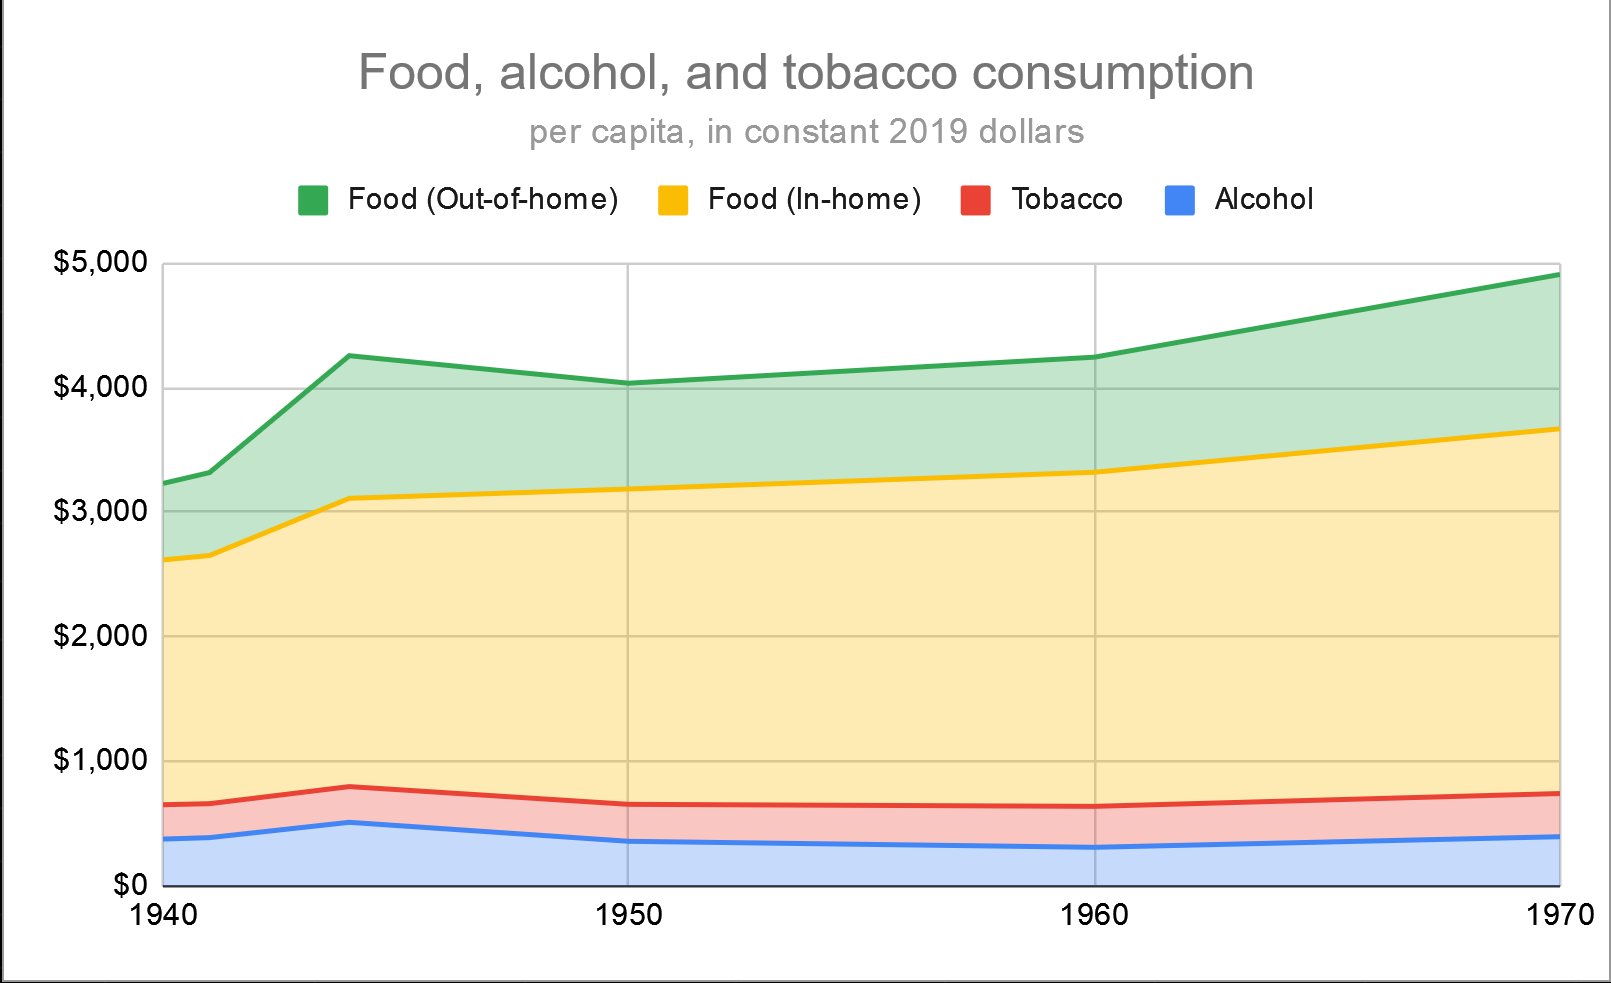
Digging a little deeper, the increased food spending was mostly at restaurants. While we might think McDonald’s and other big fast food chains led this shift, they were actually latecomers to this trend which started in the 1940s. Real spending at restaurants nearly doubled between 1941 and 1944 alone, and stayed high after the war and into the 1950s.
The workweek in the 1950s
Of all the post World War II decades, the 1950s was the only one that saw workers’ wages actually increase relative to labor productivity. Yet our out-of-pocket consumer expenditure data in the above chart looks almost flat. What happened?
First, the 1950s saw one of the biggest reductions in hours per worker in the postwar era— dropping from 42.7 to 40.9. Per capita hours worked reached its lowest point ever in 1960 as the baby boom reached its peak. Could it be that the many young parents of the time wanted to spend more time at home with their children?
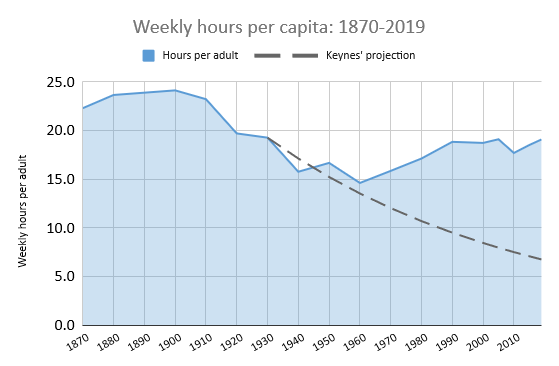
Still, a 1% yearly increase in efficiency as Keynes predicted would suggest a 4 hour drop in the average workweek over a decade1, with a bigger increase in income than the consumer expenditure surveys suggest. What’s missing?
As it turns out, out-of-pocket household expenditures don’t capture the full story, but GDP, which includes investment and government spending, does. Most of the remaining extra income that workers received for not cutting their hours as quickly as Keynes projected was paid back in taxes to fund government spending and increased Social Security benefits, as well as payments towards private insurance and pension plans. Homeownership also increased significantly, so housing’s portion of GDP rose faster than just the rent and mortgage payments that would be captured by the Consumer Expenditure Survey.
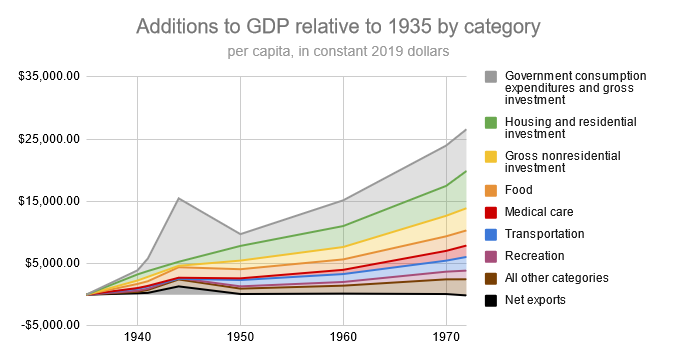
Overall, it seems like workers in the 1950s decided to split their extra hourly earnings largely between somewhat shorter hours, improved public infrastructure, and increased security (both financially and in terms of national defense during this period of the Cold War).
The workweek in the 1960s
The average workweek only dropped by about an hour in the 1960s, but consumer spending increased quite a lot across all categories. Like the late 1940s, people largely chose to earn more money directly rather than reducing their hours. This time, recreational spending was a significant part of the increase, and it is striking to see how much it went up in the mid-1960s when color TVs hit the market.
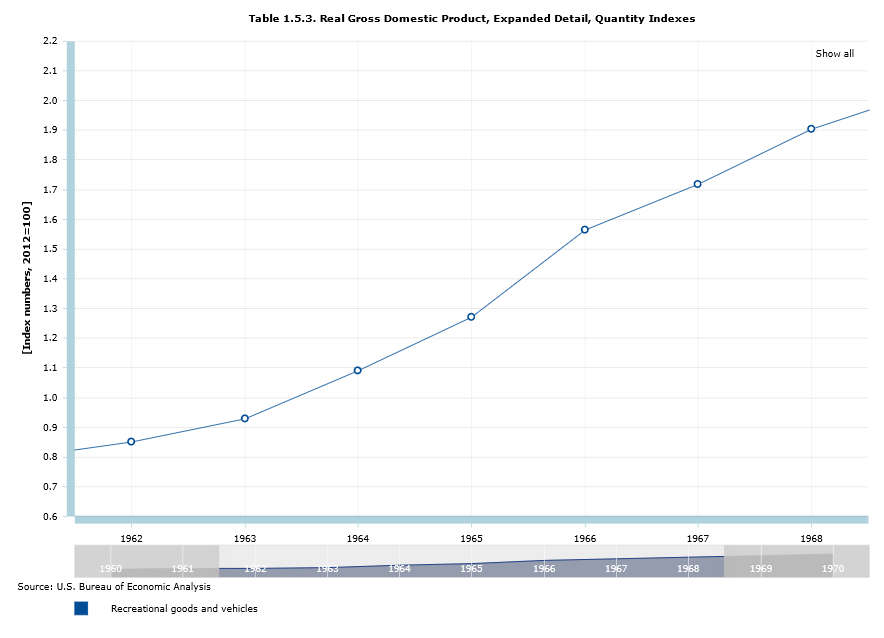
Still, the increase in spending on vehicles and housing stand out. How much of this demand was induced by public policy in the previous decade?
The workweek in the 2010s
After decades of wages falling behind productivity, the average worker finally saw pay keep up in the mid and late 2010s. But aside from a temporary decrease during the depths of the pandemic, the average workweek hardly changed. Were the 2010s another decade like the 1960s, with all sorts of new products available that motivated people to work longer hours to buy them?
Not exactly. Let’s take a closer look at what people spent more money on:
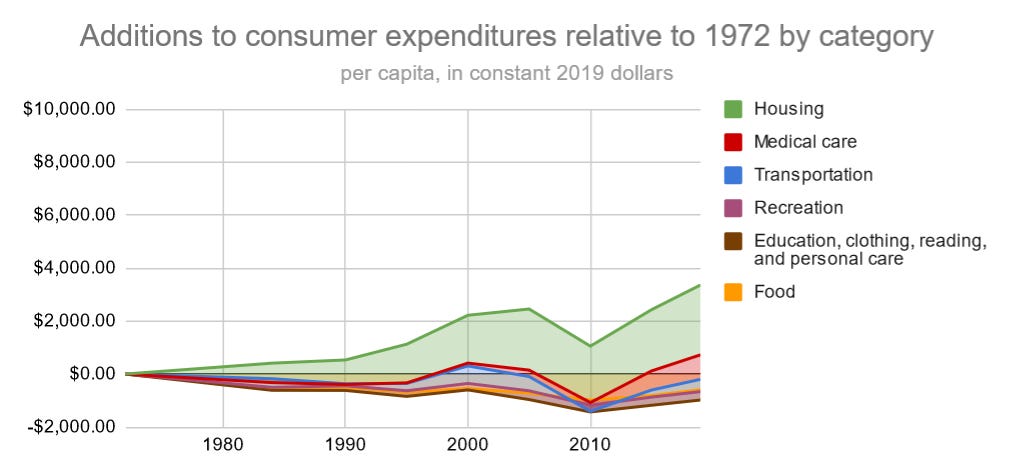
The most significant increase is a continuation of a trend seen since 1970, where the majority of extra spending is concentrated in the basic needs of housing and healthcare (and some cyclical extra demand for vehicles). During some of the leaner previous decades, increases in spending in these categories were only possible because the price of food and clothing fell.
We might expect an aging population (with a rising obesity rate) to incur more non-discretionary healthcare expenses, and paying for healthcare (whether out-of-pocket or through an employer-provided plan) is undoubtedly a factor in keeping people from pushing for a lower ideal number of hours. But how discretionary is the increase in housing expenses?
We can take a closer look at per capita consumer spending data by income quintile for more clues about this:
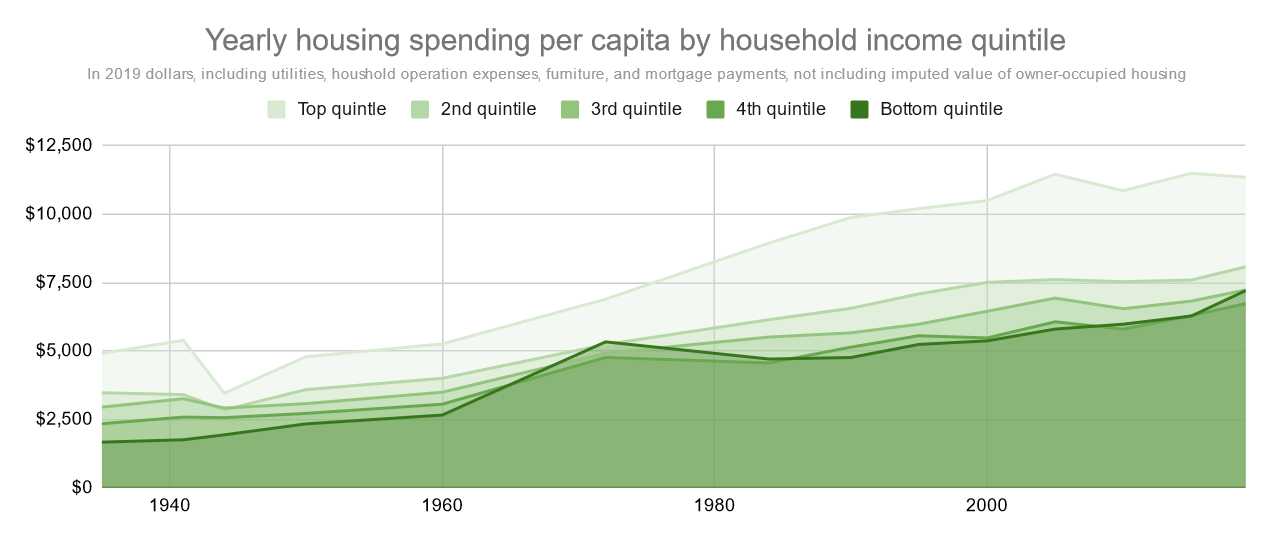
What is remarkable about housing expenses is how closely bunched together the bottom 4 quintiles are, and how much of a steady upward trend there has been across all groups. Indeed, the lowest income quintile (which includes a large number of retirees with smaller households) has passed up the next quintile and is neck-and-neck with the middle one!
This is in contrast to more discretionary expenses like transportation and recreation where there is clear separation of each income group:
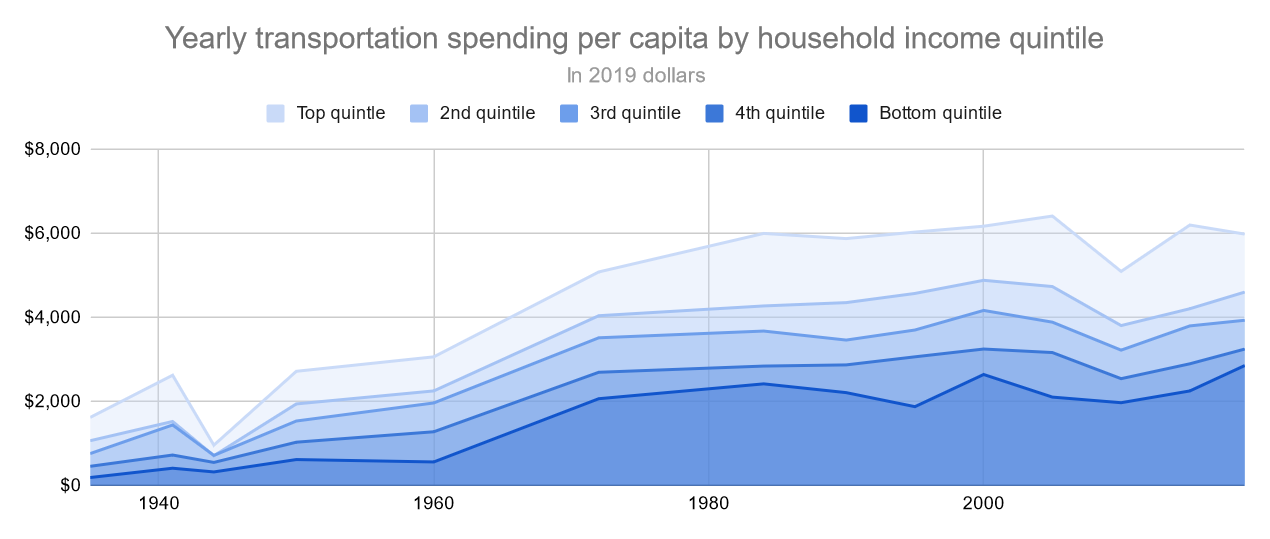
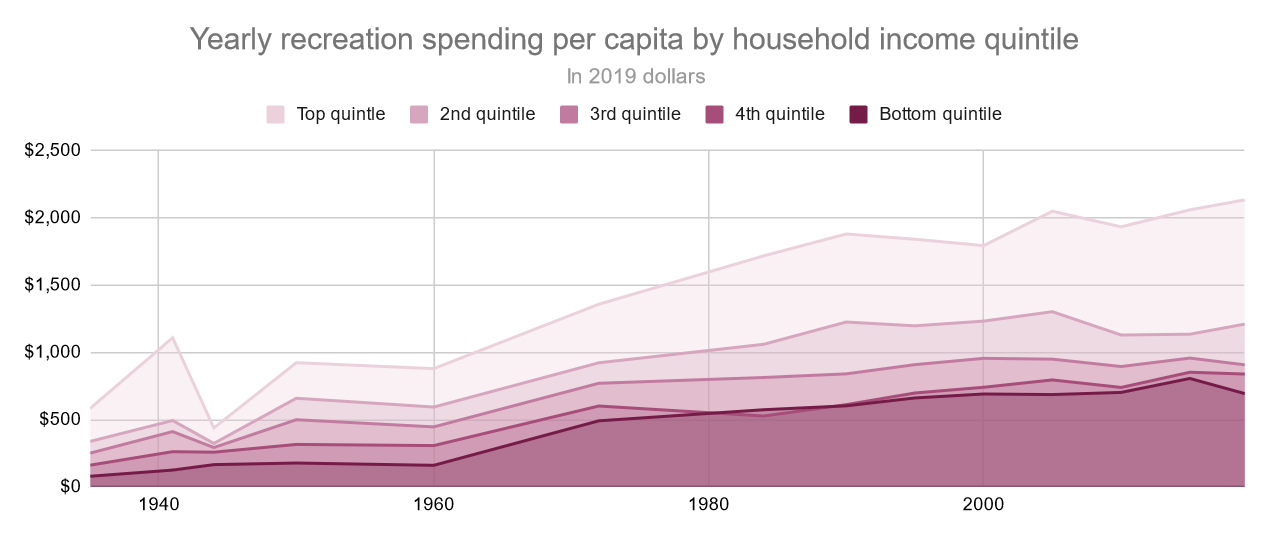
This really stood out to me when I first put these charts together, and what it suggests is that the higher housing costs for these lower income groups are not discretionary— the cost of housing really does seem to be outpacing inflation over the long run.
Bringing it all together
So when do workers prefer more free time vs. more money?
If the 1950s is indicative of anything, kids might have been the biggest motivator for a shorter workweek in the postwar era. This conclusion is probably unsurprising to parents, but it is sobering to consider how there have really only been a few windows of time where American workers have had the bargaining power to demand a salary and working hours commensurate with their productivity.
And even in these favorable times, renters and homebuyers still need to have bargaining power to come out ahead, something that can be made more difficult in a housing market heated up by lack of supply. Geopolitical conflicts and economic shocks cause people to invest more time than they might otherwise prefer in securing themselves both physically and financially.
After all that, it seems like people will voluntarily work longer hours for more money when there are new and exciting products available. The construction of the interstate highway system and other car-related infrastructure in the 1960s, as well as the mass production of TVs in the 1950s and 60s are good examples of this. And looking at how much time Americans today spend both traveling by car and watching TV, it should hardly be surprising that earlier generations were also willing to put in more hours for these modern conveniences.
Looking forward, one might wonder what sorts of new technologies will change how people use time. To what degree does public policy influence this? What can we expect over the next 100 years?
Stay tuned for the next edition of 2120 Insights!
In the meantime, if you haven’t already done so, check out how Americans’ typical days have evolved from 1965 to 2019 here, and subscribe for more updates below.
Theoretically, there should have been even more than a 4-hour decline in the 1950s given how many more women were in the workforce by 1960 compared to 1930.
Great writeup! Something I always wondered about is whether certain cohorts of workers have especially strong bargaining power to reduce hours. For example, those whose personal expenditures aren't increasing much while their income is growing. Maybe folks in housing-abundant areas that have tight labor markets (Minnesota?). Curious if you had any thoughts there.