

Is the government keeping the workweek long?
Is the government keeping the workweek long?
Looking at a few ways policy has explicitly and implicitly influenced the length of the workweek

As we explored in our look at the workweek from 1870 to 1910, some policies (such a child labor and mandatory schooling laws) precipitated conditions to allow for shorter workweeks for all. In other cases, as we saw in our look at 1910-1940, laws like Adamson’s Act and the Fair Labor Standards Act of 1938 codified what was already becoming a common practice.
However, after 1940, the progress towards a shorter workweek began to slow down. A number of policies over the past 80 years may have been indirectly responsible. Let’s take a closer look:
Housing policy
The remarkable rise in household debt, facilitated by policies promoting home ownership starting in the 1940s is one area worth exploring. Did this, combined with the failure of the market to provide more traditional urban housing, induce demand for more spacious single-family homes than there would have been otherwise? And did this motivate people to keep working longer hours? And has this, combined with zoning restrictions (which people are likely to favor more after they become homeowners) made homes artificially scarce, bringing up their price?
These are complex questions worth exploring in more detail in a future article more specific to housing costs. But one effect is sure: US housing policy favored suburbanization in a way that induced more demand in another area: vehicle ownership.
Transportation policy
First, let’s look at how much money Americans have spent per capita on vehicles over time:
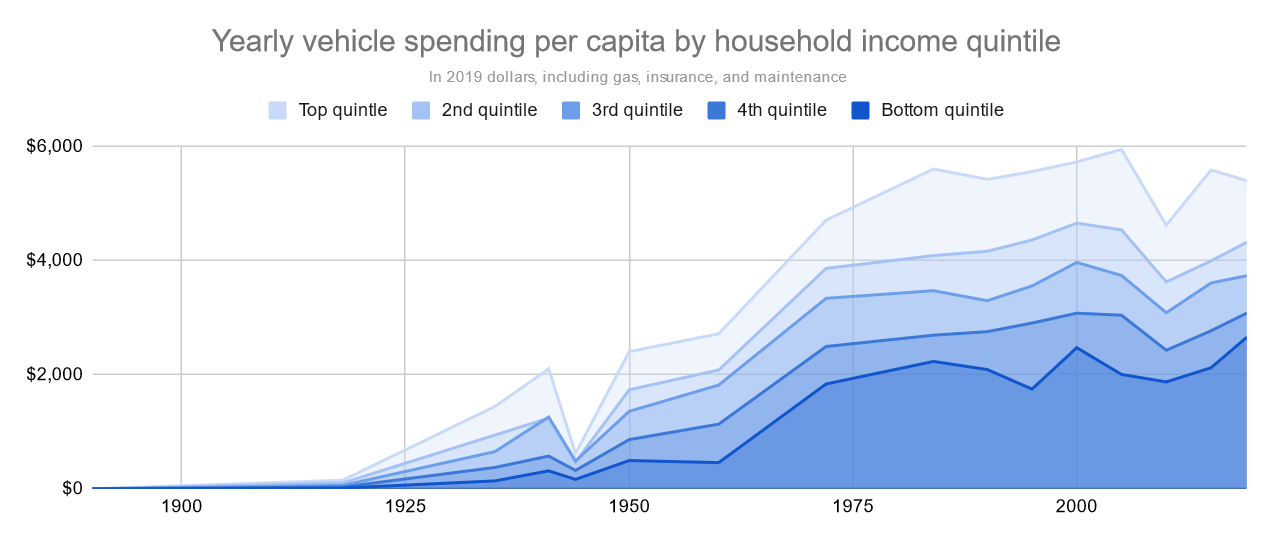
The sharpest rise across all income groups is seen in the 1960s. As we explored earlier, this was a decade where there was a big jump in income across the board, and a strong revealed preference towards more income (and consumption) rather than shorter hours.
But was this growth in vehicle expenditures entirely organic? As it turns out, this surge in vehicle purchasing was immediately preceded by a massive government investment in the highway system that accompanied the mortgage-fueled suburbanization of the country.

Federal transportation-related grants quintupled from about 0.1% of GDP to over 0.5% between 1955 and 1959 as construction of the interstate highway system began. This doesn’t even include other state and local spending, which according to the 1962 Census of Governments brought highway spending to roughly 1.5% of GDP overall.
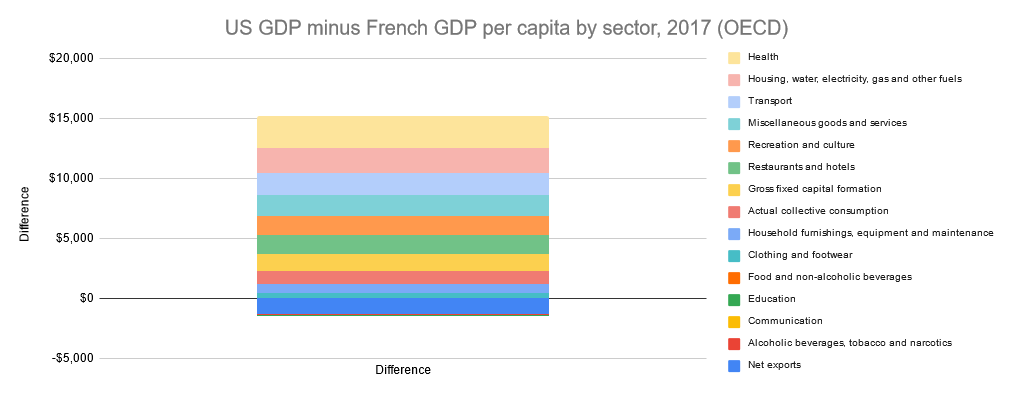
Indeed, the higher American vehicle ownership rate (and related single-family homeownership) is one of the primary factors that puts U.S. GDP per capita over other countries like France and Germany that have similarly productive and diversified economies but shorter working hour. It is interesting to note that France and Germany’s GDP per capita per hour worked is nearly even with the US over time.
The degree to which American infrastructure is designed around universal auto ownership, based on decisions that were made in the 1950s and 60s made the country more vulnerable to the oil crisis and inflation of the 1970s. But far beyond that, these decisions will continue to affect our environment, economy, and typical workweek for decades to come.
Healthcare policy
If keeping up with the Joneses in terms of houses and cars (with the encouragement of government policies) has kept workers from thinking too much about cutting their hours when they might have been able to, the evolution of private health insurance gave their employers an extra incentive to keep hours long. This is an important divergence to consider, given that many European countries where work hours continued to fall followed a different path.
While the idea of a national health insurance system similar to the European ones that were developing at the time had been proposed as early as the 1910s, healthcare was assumed to be a state responsibility and not a federal one in the US. A more federal approach was considered in the 1930s, but the priority of reducing unemployment ultimately took precedence. A meteoric rise in the percentage of Americans covered by private healthcare plans in the 1940s (from 8% to nearly 50% in that decade alone) disincentivized Congress from returning to this later. Medicare and Medicaid, which came about in the 1960s merely covered the gaps that were becoming increasingly apparent in this system as retirees and the unemployed usually lacked coverage.
And so the incentives were set— employers wanted to get their “money’s worth” out of the employees whose health benefits they were paying for. Employees became more dependent on their jobs for these benefits and would be less likely to quit, especially as their bargaining power declined in the 1970s and beyond.
The rollout of Affordable Care Act, and improving conditions in the labor market over the 2010s has in theory given workers more flexibility. But the rising cost of healthcare, both insurer-paid and out-of-pocket, and worsening overall health complicates the outlook. We will take a closer look at what this means for the future in another chapter.
Restrictions on unions
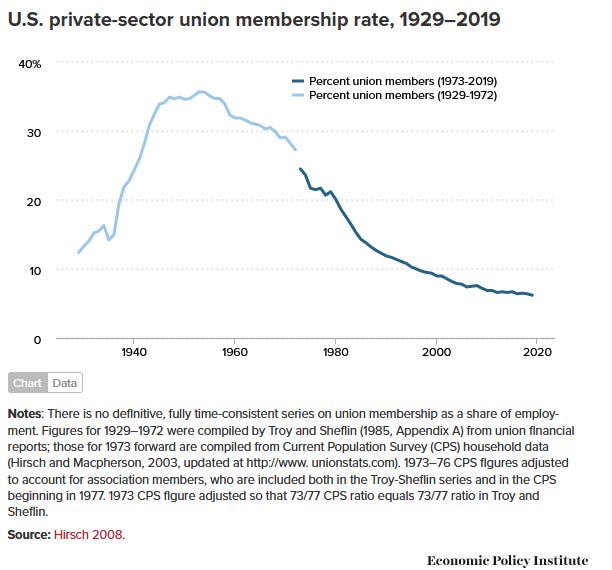
We have seen how workers’ bargaining power declined significantly starting in the 1970s. Union membership also declined significantly during this period. What sorts of government policies precipitated this?
The stage was set for this decline in union power surprisingly much earlier, with the passage of the Taft-Hartley Act over President Truman’s veto in 1947. Among other provisions, this act put restrictions on what types of strikes were allowed, and also allowed states to pass “right-to-work” laws which prohibit unions from preventing employers from hiring non-union workers. A number of states subsequently enacted these provisions.
Still, collective bargaining efforts were relatively successful through the 1950s and 60s— the number of union elections were high, and the success rate was well over 50%, and as high as 65.8% in the 1950s, coinciding with the decade where American workers saw their highest pay raises relative to productivity.

It was in the 1970s and 80s when the situation changed. The 1970s saw quite a bit of activity, but much lower rates of success as companies brought in non-union labor to break strikes. By the 1980s, union activity fell precipitously as did union membership— from 20.1% to 11.7% by the end of the decade.
This begs the question: WTF happened in 1971?
