How much more productivity would we actually need to get to a 15 hour workweek?
How much more productivity would we actually need to get to a 15 hour workweek?
What would have happened if we went full speed ahead as Keynes predicted?

Economically speaking, there are two options to get to a shorter workweek overall: either less consumption, or more productivity.
Whether or not we could reduce our consumption and still maintain an overall high level of well-being is something we might explore later. But the more likely path to the 15-hour work week, as Keynes predicted, is through more productivity.
Productivity comes in a few flavors. We can be more productive because we have more experienced workers, or more machines. Alternatively, we can be more or less productive for other reasons, including improvements in technology, or fluctuations in energy prices.
Back in his 1930 paper, Keynes broke out these sources of productivity. He estimated that a 2% yearly growth in the capital stock (more machines, etc.) would contribute to a direct 2% increase in standard of living each year. At the same time, he hypothesized that technology would make us 1% more efficient each year, which we would lead to 1% fewer hours worked per year.
This sounds logical until we take a closer look. A 2% increase in machines without any increase in operators means that Keynes was really banking on an extra 2% of labor efficiency on top of the 1% of technical efficiency he had already predicted in order for the additional capital to be relevant. This is a glaring omission. Fortunately, increases in technical efficiency actually somewhat exceeded expectations. Taking all of these things into account, if U.S. workers had opted for as short of working hours as possible, how close could we have come?
Here’s what’s actually happened since 1954:
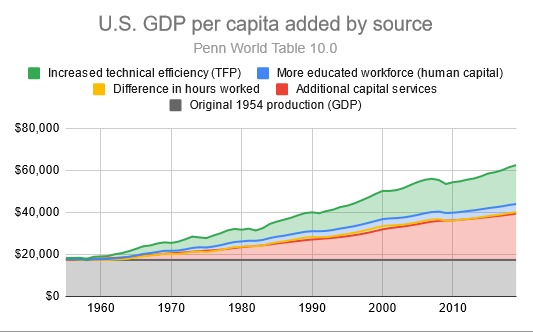
Our average GDP per capita growth was nearly exactly what Keynes predicted at 1.97% per year. The value provided by capital increased by 2.31% per year, faster than Keynes’ projection for capital growth, but only being responsible for a little less than half the overall increase due to Keynes’ oversight on either needing more operators and/or technical efficiency.
The other half of the growth since 1954 comes from a mix of sources.
The smallest sliver (in yellow) comes from actually working more hours per capita than we were back then— this is largely due to children being a smaller fraction of the population, and the great increase of women’s labor force participation in the 1970s and 80s.
The next largest piece (in blue) can be accounted for by the higher skill level of workers, as people on average now attend school for much longer than they did in 1954.
The lion’s share of our remaining gains come from technical efficiency (in green), also known as Total Factor Productivity
Let’s suppose we instead just decreased our work hours per capita by 1% per year as Keynes predicted, but everything else remained the same. Where might we have ended up?
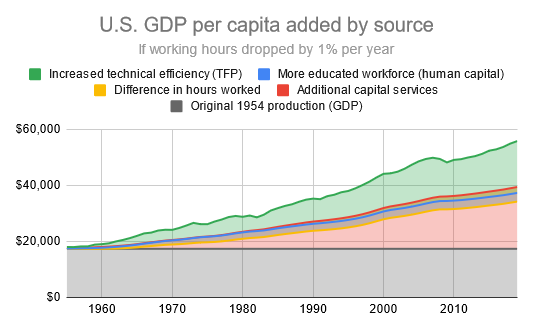
In this scenario, we end up with only a marginally lower GDP per capita of $55,816, with an average workweek of just under 22 hours in 2019 (or alternatively a 25-hour workweek with 6 additional weeks off). We can take another 20%+ off these figures if we account for the higher labor force participation in 2019— effectively a 20 hour workweek with 10+ weeks off per year for the average worker, with the same standard of living as Australia or Finland!
But is this scenario realistic? After all, capital and labor aren’t perfectly exchangeable— it’s not evident that we’d make full use of our additional capital with half as much working time. It’s also an open question of if we would even be able to produce that much capital in the first place with a leaner workforce.
Looking at France gives us some hope that getting at least halfway to this scenario might have actually been possible. Overall hours worked per year per capita in this country have dropped by 0.75% per year since 1954— almost what Keynes predicted! In contrast, hours per capita in the U.S. have increased by 0.12% per year (note that the chart below just shows average hours per worker and doesn’t take into account the greater rise in labor force participation in the U.S.).
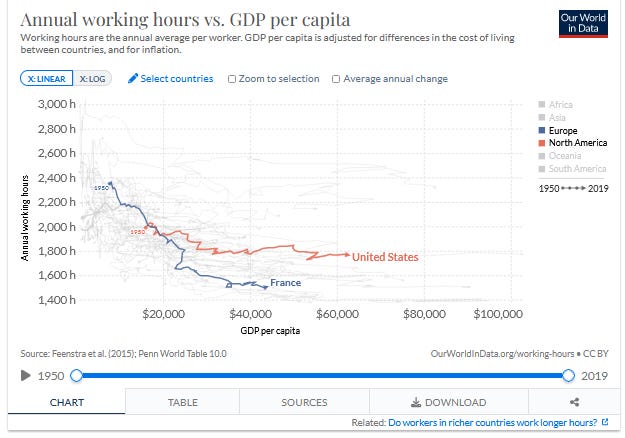
There are a few caveats to this of course. The French worked considerably more than Americans in 1954, and most of the decline in their working hours takes place prior to the 1990s. On the other hand, labor force participation in the U.S. is higher, due to a younger population, and more young people, seniors, and women in the workforce— this brings up per capita hours worked.
Let’s model a scenario that takes all of this into account: where hours per worker in the U.S. fell to the same level as they currently are in France, but at a slower rate (given that the U.S. had a head start in 1954). We will assume that the higher U.S. labor force participation rate and level of education is desirable and remained at its historical level. We’ll also imagine in this scenario that we maintained the same growth in total factor productivity.
Should we reduce the contribution of capital according to the reduction in labor, since there would be less labor available to produce this capital in the first place?
Again, if we look at France, the growth in capital’s contribution (at 2.61%) is considerably higher than in the U.S., in spite of shorter working hours. This may be due to France’s more difficult starting position, recovering from the destruction of a considerable amount of capital during World War II which did not occur in the U.S. But an environment where increasingly shorter working hours are the norm might also have an influence on the quality of capital that is produced (from a higher concentration of robots in the French manufacturing sector to Paris' iconic self-cleaning toilets).
Assuming that U.S. capital growth is the same as it was historically, here’s what we end up with:
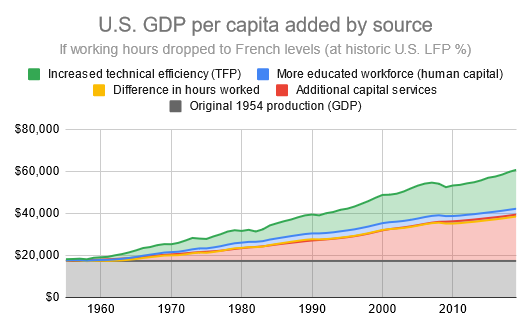
We really aren’t far off from our current level of GDP at $60,729— well ahead of even Denmark and the Netherlands in 2019! In exchange, we’d be getting 3 hours less per week and 5 more weeks off per year. This is quite impressive for such a plausible scenario.
Of course, there are certain adjustments that Americans would have to make that aren’t necessarily measured in GDP. When I was touring France by bike this summer, I had to be much more mindful of working hours— making sure to stop for lunch well before 2 PM when most restaurants closed.

I once arrived at a campground just before 10 PM and set up my tent in an open spot, expecting to settle the bill the next day. I got in trouble for that— I should have arrived earlier and checked in with the host before they went home for the evening at 7 PM. A friedn of mine who lived in France for a year fondly remembers getting hung up on by a customer service agent who was about to go on their lunch break.
Personally, I found these experiences to be refreshing. Being more conscientious of other people’s working hours seems like such a small price to pay for a better work-life balance for everyone.

But could we one day see such a cultural shift in the U.S.? What does all this mean for the future? Here are a few other things I hope to explore soon:
The emerging generational gap in hours worked: U.S. Millennials vs. Boomers
The relationship between time, working hours, economic growth, and productivity across countries: based on historical trends, what level of decline in working hours is realistic? What might we see in 2120?
Remote work vs. offshoring: what does the future hold?
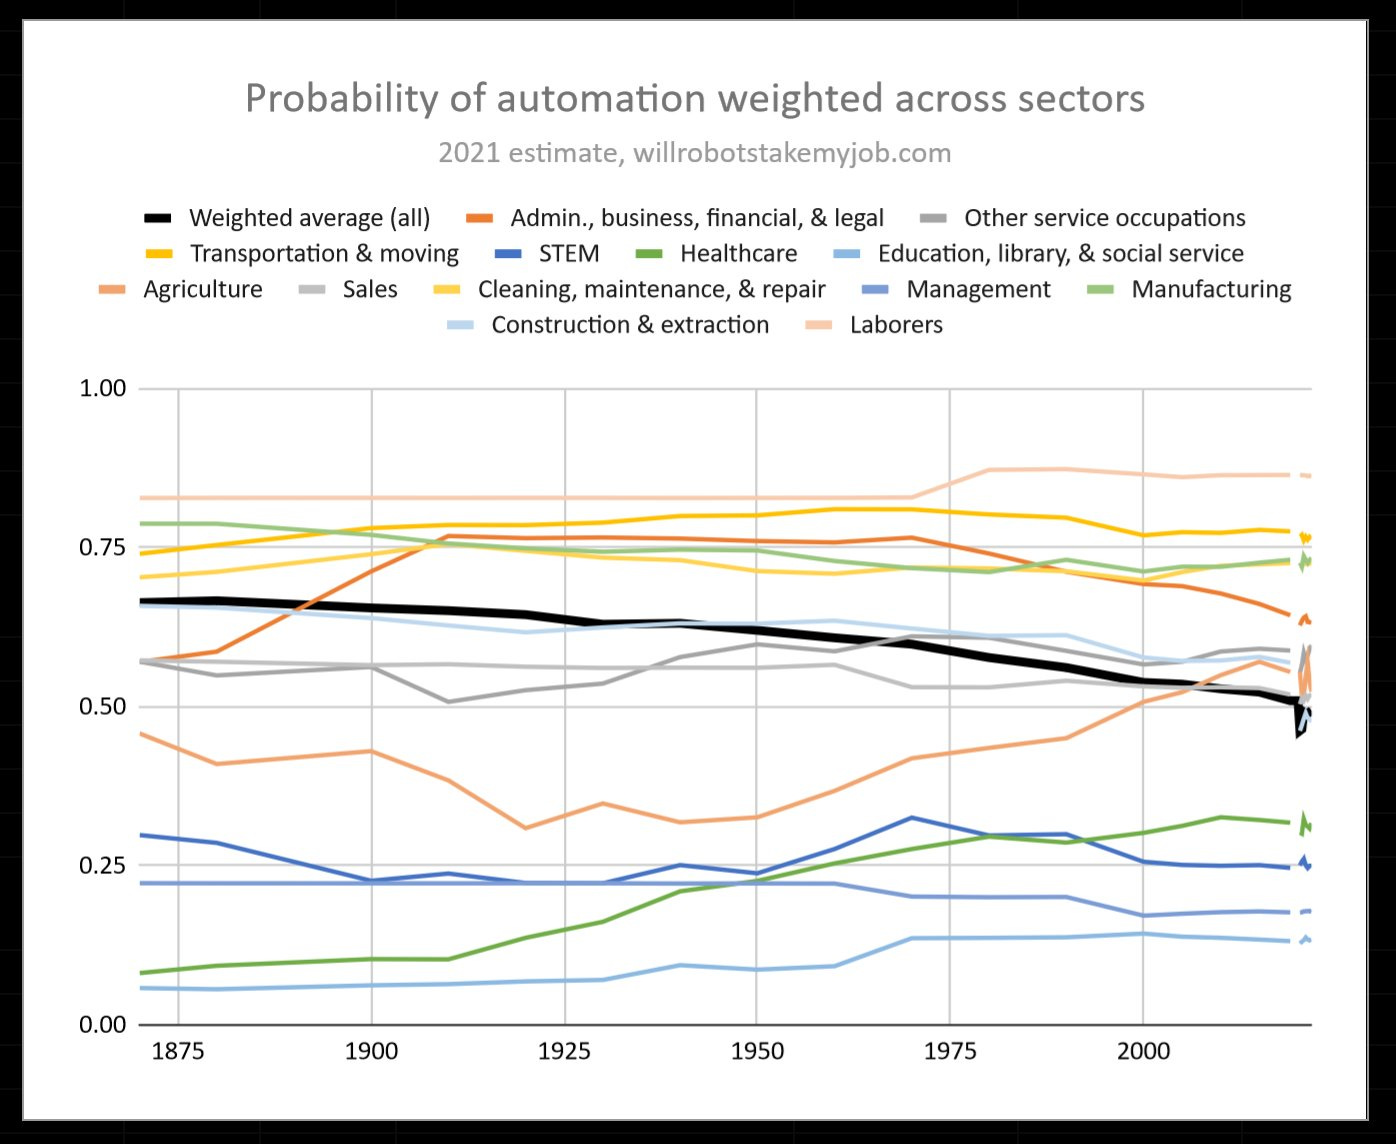
Exploring the latest trends in automation, and the potential impact of AI: expanding a little more on this visual I built earlier this year, adding the latest numbers from the Current Population Survey: