

How can I turn overwhelming tabs into useful tags?
How can I turn overwhelming tabs into useful tags?
Lessons from a metacognitive odyssey in Google AppSheet

In January, I wrote about a system I’ve been building in Google AppSheet1 to kill my tabs once and for all. I created a database to keep track of my writing priorities, interesting things that I’ve read that I’d like to come back to, and the questions answered by both. Today, I’ll go into a little more detail about my questions (and higher-level concepts), which are essentially just a very fancy system of tags.

In any normal research project, one might have a dozen or two tags that would be pretty self-contained. But my interest in writing about the future is very broad and long: there’s enough material to keep me busy for more than a lifetime. The hundreds of tabs I had open a few months ago were on their way to becoming thousands. With this level of volume, I’d either have tags that were too broad, or just too many to keep track of. I’m happy to report that after two months, I’ve finally found a happy medium by building out a hierarchy for my tags using the following principles:
Stay focused on the goal
Think like a scientist
Consistent language helps avoid duplicates
Standardize rules for each level of the hierarchy
Keep the hierarchy as shallow as possible
1. Stay focused on the goal
In writing 2120 Insights, my goal is to make predictions about the long-run future that are as thoughtful, optimistic, and hopefully accurate as I can. I’m not in the business of predicting specific near-term events (e.g. “Who will win the 2024 election?” or “Will there be a war between the U.S. and China before 2040?”), but I am interested in what daily life, as measured by time use surveys, might look like in the year 2120.
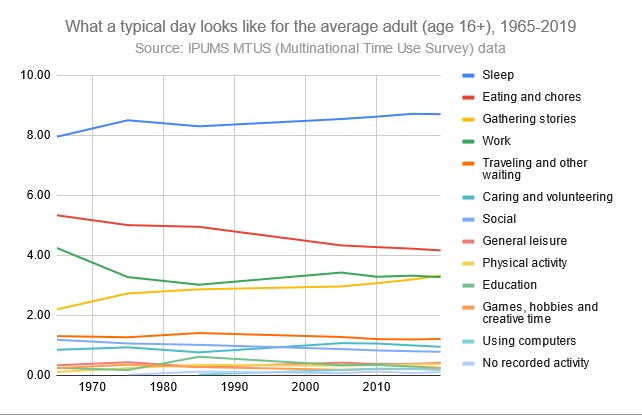
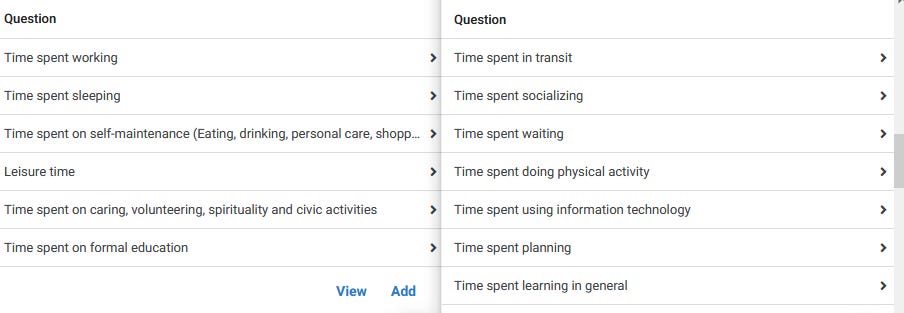
With this in mind, my first inclination for a tagging system was to have all of my questions and concepts related to different time use categories. While there are over 600 of these in the American Time Use Survey, I was able to settle on 6 broad primary categories and 7 secondary ones as my high-level conceptual tags.
Of course, not every important concept is directly related to how we use time. Our core motivations, level of wealth, and the trajectory of different forms of technological development are just a few of many different predictive factors.
Figuring out how to categorize these forces, and the effect they might have on daily life, was the next part of the process.
2. Think like a scientist
I did a lot of process mapping as I was thinking about what things have the biggest impact on how we end up spending time. After many iterations, I ended up with this one, which I think captures everything at a high level.
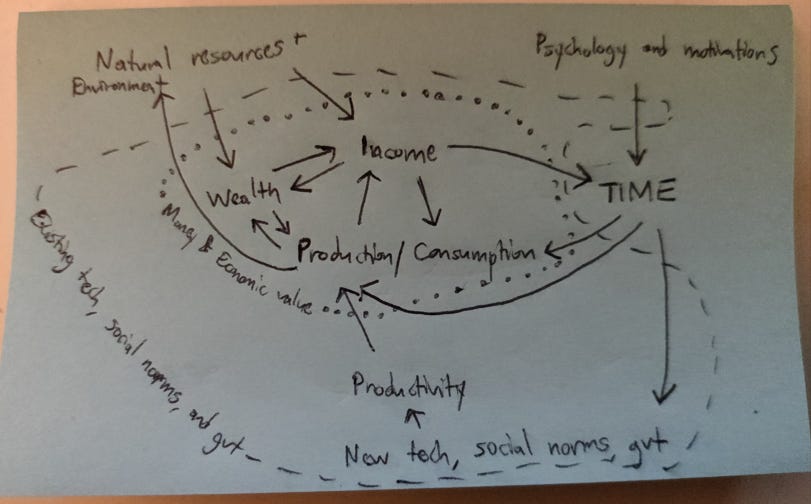
In thinking about how much time we might ideally choose to spend working vs. on other activities, the relationship between time use and all of the other concepts related to money and value (production/consumption, wealth, income) is at the center.
The environment, the natural resources available to us, and our own psychology and motivations are important influencing factors.
Finally, investing our time and wealth into better technology, social norms, and more advanced forms of government ideally helps us realize more satisfying uses of our time (and more of it as life expectancy improves).
With these as my high-level concepts, I’m able to tag what I read (or what I plan to write about) as related to either one of these concepts, OR a causal relationship between two concepts. And it’s this causality that drives predictions. For example, new tech or policy influences our productivity, which then influences our income, which ultimately influences how we use time. It’s helpful to keep my research organized along each step of this causal loop.
3. Consistent language helps avoid duplicates
If these ten high-level concepts and the relationships between them were enough to cover everything I wanted to write about, we could stop here. But of course there are additional levels of detail for each one, and the more I put in my database, the higher the risk of duplication.
This is probably the most persistently tough part of the whole organizing process, and I still struggle with it. With roughly 500+ tags and counting2 in my database, it can easily get out of hand.
Having a high level view into how I envision causality3 helps eliminate near-duplicates like:
How does labor force participation influence consumer spending/economic growth?
How does GDP influence the distribution of working hours?
Using broad terminology that includes common high-level elements either in parentheses or in the “notes” section helps me find tags more readily before I create a dupe:
Instead of: How does income inequality influence wealth and capital growth?
Use: How does income inequality (Gini index) influence wealth and capital growth?
Finally, I try to use language that’s as simple and standard as possible to phrase the questions that make up my more detailed tags, like:
How is time use is measured and predicted?
These sorts of questions help me keep track of explanations for different methodologies (which admittedly befuddled me when I first started this project).
This leads straight into my next point:
4. Standardize rules for each level of the hierarchy
At the highest level, concepts are too broad to be specific questions, so format rules are pretty loose. But a few levels in, having some “types” of questions which follow the same rules regardless of whether they are related to time use, government policies, or human psychology has been very helpful not only for reducing the amount of duplicates, but also for getting a sense of how broad or narrow a question is in the grand scheme of things. The three most common types of questions, at a high level, are these:
How does the nature of… [artificial intelligence] evolve over time?
Any sub-questions about more specific forms of AI tech (generative, language processing, visually responsive, etc.) would be grouped here.
How does the distribution of… [income] evolve over time?
Any sub-questions about how income varies across important demographic categories (age, gender, etc.) would be grouped here, along with questions about more specific measures of inequality (e.g. the Gini index).
How does the flexibility of… [time spent on work] evolve?
This question hits on an often-overlooked aspect in the way that we use time that I’d like to do more research on. And since this one is directly related to time use, I’m interested in seeing how much this affects satisfaction with time spent, in addition to questions about the nature and distribution of work. We might love our job, or love to take care of our children, but how much might an extra week of vacation, or more flexible hours, or having easier access to childcare make us feel even more satisfied? Conversely, when does too much choice and not enough structure lead to anxiety?
I have more detailed formats for questions too. But how detailed do I get? With so much to write about, I have to avoid going too deep into any one rabbit hole.
5. Keep the hierarchy as shallow as possible
What is the right level of detail to go into when your subject is as broad as “what might life look like 100 years from now?” Even trying to limit myself to things that might be more predictable on long timescales, this was something I wasn’t very sure of until recently. But having a standard format for my questions helped. Ultimately, I realized that I could cap my tag hierarchies at 7 deep.
Below is the hierarchy for one of my most detailed questions, “How do robots influence employment and unemployment?”

The top three levels are all too broad to be questions; I think of these as concepts. Getting down to the 4th level, the high-level questions I mentioned previously are helpful for routing the more specific questions down to as many as three more levels of detail.4
Similar to capping my hierarchy at 7 levels, I also try to cap the number of questions or concepts at 10 children per immediate parent, and allow only 1 parent question, lest my neat hierarchy become something like this…

These rules still allow for a ton of questions— in theory, I could get past a million! But in practice, it looks more like this:
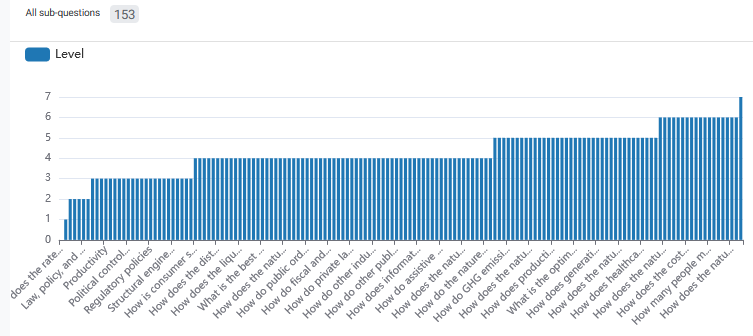
More detailed questions (the higher numbers on the right) will slowly be added as I write more, but I am starting out at a more general level first, and 4th-level questions— the general ones about the nature, distribution, and flexibility of various concepts— are the most common ones right now.
I have these neat little visualizations built straight into my Appsheet app and can even pull these up on my phone! I also have some pie charts to keep track of which high-level concepts have some sort of causal relationship with whatever tag (question or concept) I’m looking at.
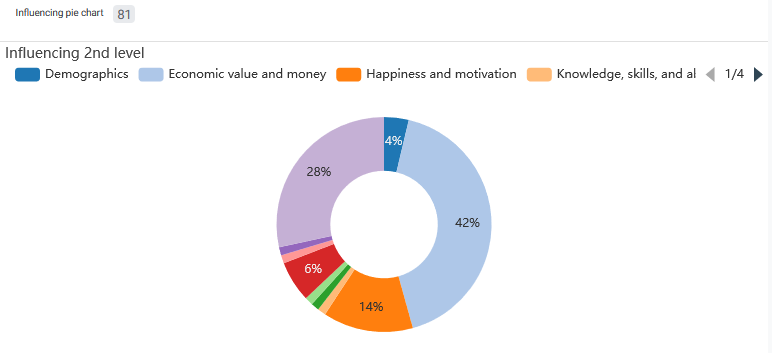
I just wish there was some way to combine these two charts.
Bringing it all together
A robust system of tags like these goes beyond simply linking what I read with what I plan to write about. It can be a compass as well, tracking what I’m focused on, and what I’ve potentially neglected.

This treemap is the first part of a dashboard that I’m building to keep track of all of the tags in my database. Currently, it just shows the number of questions and concepts I have in each high-level category, but I can use the same infrastructure to keep track of how many articles I’ve saved, what I’ve written about, or even highlight what I feel most unsure about, or haven’t written about (What questions or tabs am I hoarding for no apparent reason…?)
As this tool has developed, I’ve been able to use it more and more to file away some tabs and let go of others. As I populate it with more content, it will be important to build in an index that pushes me toward revisiting articles that are more closely related to my upcoming topics. I look forward to writing more about it next month. But speaking of the future…
Why bother doing all this? Can’t you just ask ChatGPT or Bing?
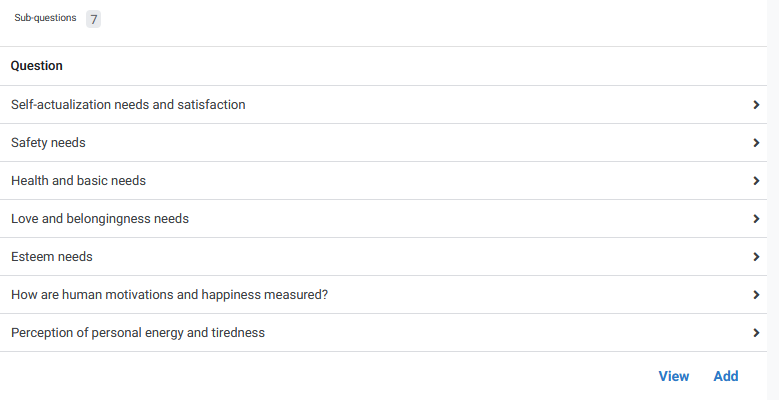
I had a great conversation with Kevin Zhai about this. The future of personal knowledge management (especially when augmented reality might add another dimension to it) is exciting! And AI has certainly proved itself to be a valuable search and content generation tool over the past few months. For instance, it helped me think through some of the sub-categorizations I made in the course of this project. At ChatGPT’s suggestion, I organized my tags related to both motivations and knowledge (roughly) in relation to Maslow’s hierarchy of needs.
While I can get some quicker answers from a variety of AI tools that query books, academic papers, or the web at large, I still have to do the learning myself. AI can suggest a syllabus or even challenge my thinking, but if my ultimate goal is to build a more intuitive understanding of what I’m studying, I still need to relate it in my mind to my existing base of knowledge. The conversation about AI learning vs. human learning reminds me quite a bit of Socrates’ criticism of writing being thought of as a “a potion for memory and for wisdom”. We can have all of the written knowledge in the world at our fingertips, but if we don’t take the time to understand it ourselves, can we really call ourselves wiser?
While Socrates might criticize how much time I’ve spent writing this database, every time I use it, I am reminded of how to better organize all of this content in my mind as well so I can speak to it better off the cuff. Going through this process has been instructive, even if ChatGPT 5 came out tomorrow and was somehow able to build everything for me.
One AI integration I would be curious about though, would be a tool that could take an article and associate it with all of the relevant tags in my database, and write a summary of key points that relate to the questions posed by those tags. This is currently more of a tedious manual exercise than I’d like, and an automation like this would be very much along the lines of the
assessment of AI as "autocomplete for everything". Perhaps this is something Tana might be able to do in the future? (Thank you again for the recommendations, Kevin!)Until next time! Looking forward to reporting back next month with as close to zero open tabs as possible 😉, and wrapping up my story of the history and possible future of the workweek in May.
Yes, 500! I think I could ultimately end up with 1-2,000 question and concept tags. I base this partially on the notion that I might be able to claim some expertise in making predictions when I get to 10,000 quality sources in my database that I have some knowledge of. If I want somewhere between 5-10 sources per question, that leaves me with 1-2,000 questions in total.
Even though in most cases, causality flows in both ways to some degree, and these are slightly different concepts, ideally I’d cite any related material using the same tag so that it’s all in one place, with important caveats noted.
I created a dashboard that tracks capital’s contribution to economic growth last year for my piece about how much productivity we’d need to have to get to a 15 hour workweek. This ended up also being very helpful for me in understanding what these subcategories should be based on the economic data that is tracked by the BLS and BEA.
Nice writeup! I didn't even really get the scale of how many questions you've generated until I read this!
Two more resources that came to mind as I read this:
1. This was an interesting approach that pulls from the field of library sciences: https://forum.obsidian.md/t/cataloging-classification-information-science-pkms-and-you/10071. It's interesting to consider that there's a whole field of study for categorization that's never really taught or talked about.
2. Your point #5 is enforced explicitly in this system which only allows for two layers of depth: https://johnnydecimal.com/. The goal of that system is different from yours, but maybe an interesting thought experiment to see if you can limit your taxonomy to 10 buckets of 10 sub-buckets.