

Do Millennials not want to work anymore?
Do Millennials not want to work anymore?
How much do generational differences really affect the length of the workweek? A story in 15 charts.

While there hasn’t been much change in the overall average American workweek over the past few decades, breaking down hours worked by age group as reported by the Census’ Current Population Survey shows an emerging split between the generations.

For the past few years, working Millennials have averaged fewer hours per week on the job than all other cohorts at their age except the younger half of Generation X (which also includes a few “elder Millennials” born as late as 1984).
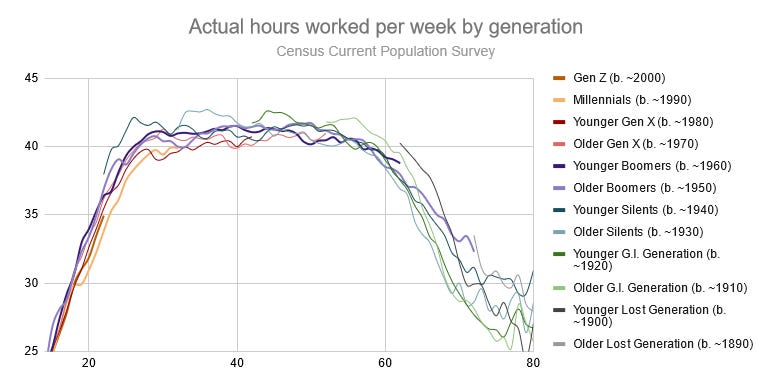
Of course, Gen X’s working hours were heavily impacted by the Great Recession of the early 2010s, just as younger Boomers’ working hours were cut by the deep recession of the early 80s. But unemployment was at a 50-year low both in 2019 and 2022, and Millennials’ hours still end up about 2 hours per week below the averages of previous generations at similarly prosperous economic times.
The shadow of the Great Recession
One hypothesis is that the “gig economy” which arose during the Great Recession keeps unemployment low but under-employment high, and Millennials are more likely than their predecessors to be doing hourly or “gig” work.
While the percentage of Americans who work for hourly wages is at a record low going back to 1979, many hourly and “gig” workers would fall in the category of “Other service occupations”.
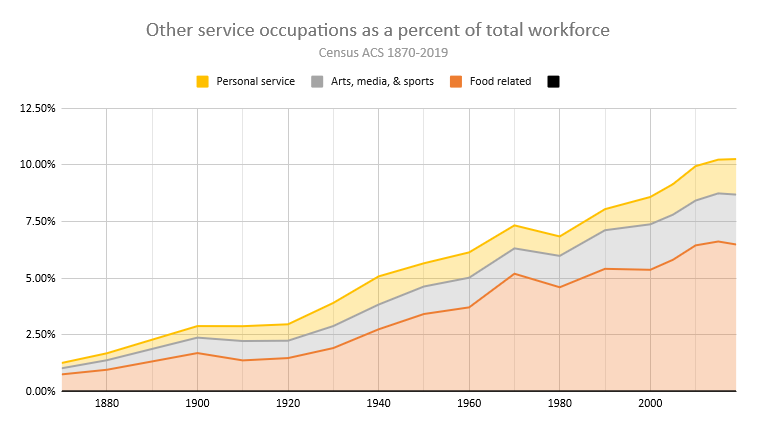
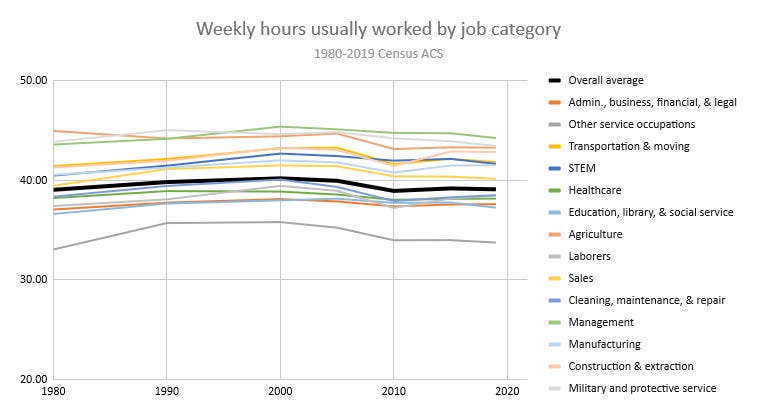
While this category, which mostly includes food service workers, didn’t grow as quickly in the 2010s as it did in previous decades, it is notable for having the lowest weekly average hours of all occupations.
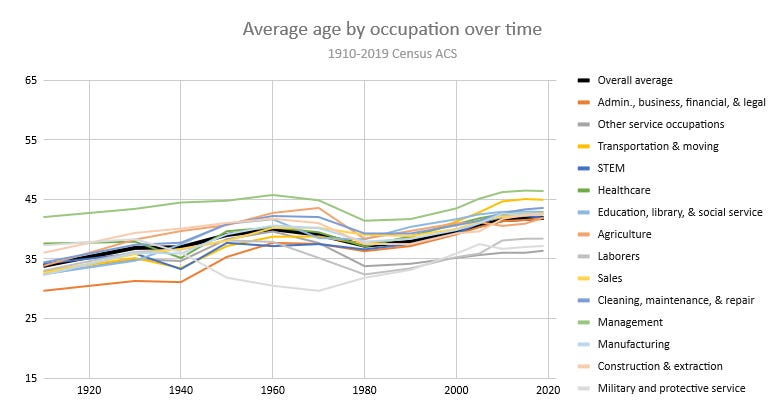
And while most occupations are getting slightly older along with the population as a whole, “Other service occupations” still averages near where it was before. This suggests Millennials are even more likely to be in this line of work than their predecessors.
It’s also worth noting that “Other service occupations” pay less than any other type of job. And given that workers in lower-paying occupations in the US are less likely to be offered full-time work due to the cost of required health benefits, this may explain why hours worked in these types of jobs are so low in the first place.
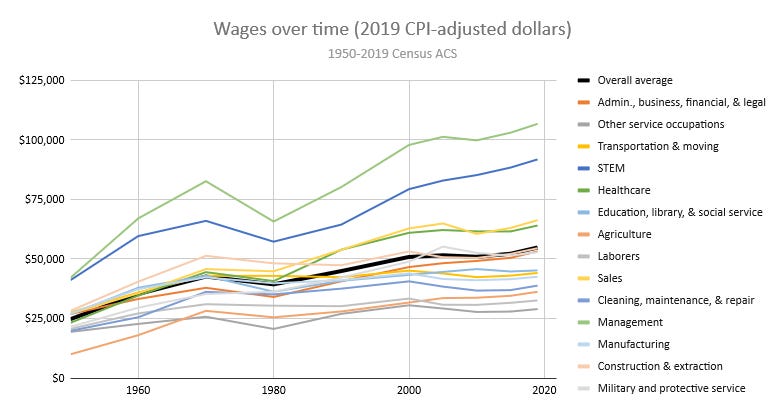
But total pay is still going up in this sector even as hours are declining— this is part of the post-2015 trend of the lowest paid workers (the 1st quartile here) seeing the biggest hourly increases in pay.
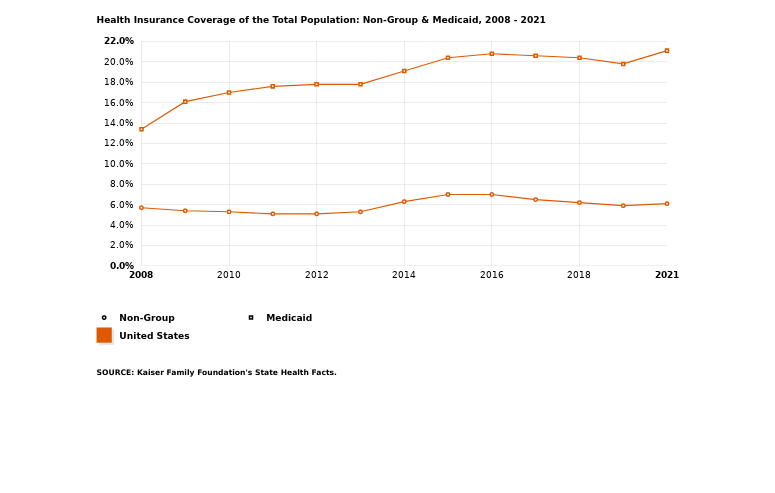
A hypothesis to explore later: could the Affordable Care Act, which has greatly expanded health insurance coverage for people in this situation (low hours, low pay, no benefits) alleviate some pressure that younger people used to have in moving from part-time to full-time work?
Or did the ACA requirement for employers to offer full-time workers benefits cause employers to cut hours, and the increased pay is unrelated (or even caused by creating a scarcity of labor)?
However, there is another layer to this decline in Millennial working hours. As it turns out, there is a significant difference here between men and women.
Men not wanting to work, women leaning in?
The difference between men’s and women’s average hours is perhaps even more striking than the generational difference.
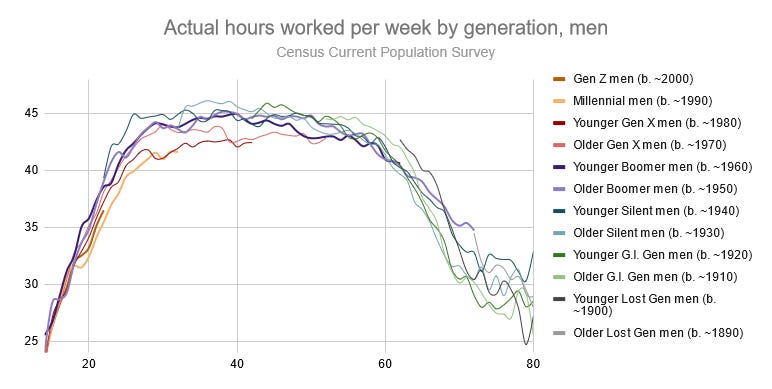
The decline in men’s hours isn’t limited to just Millennials. Gen X men, particularly the younger cohort, appear to have set this trend. And Gen Z men appear to be following in their footsteps when accounting for the strength of the economy today compared to 10 years before. Only older Baby Boomer men are working significantly more than their predecessors.
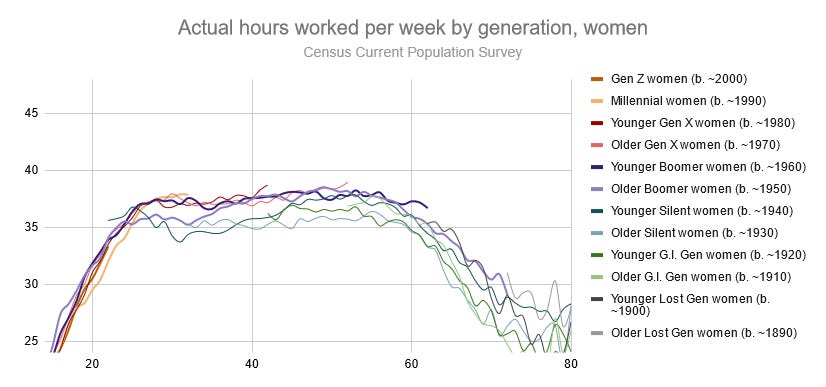
Meanwhile, women of almost all cohorts, while still working fewer hours than men overall, are setting clear records for average hours worked at their age.
This made me think of a fascinating thread I came across recently exploring why so many men continue to be out of work over a decade after the Great Recession. Rather than asking why Millennials don’t want to work anymore, should we be asking why men don’t want to work anymore?
If men are working less now, what are they doing with that extra time?
And if women are working more, what are they doing less of?
More equality… and games?
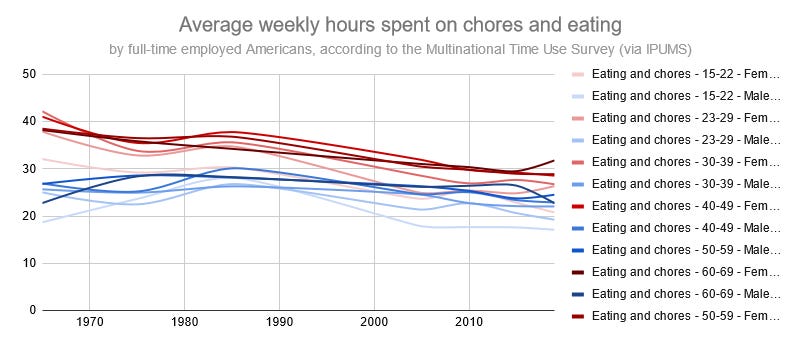
Looking at data from IPUMS’ Multinational Time Use Survey, which includes the American Time Use Survey and its historical predecessor AHTUS, the drop in the amount of chores1 done by women who work full-time jobs has been remarkable: 10 hours less per week in 2019 compared to 1965! The social and technological progress that has allowed this to happen seems under-appreciated. The details behind these numbers deserve a post to themselves, which I plan to write soon.
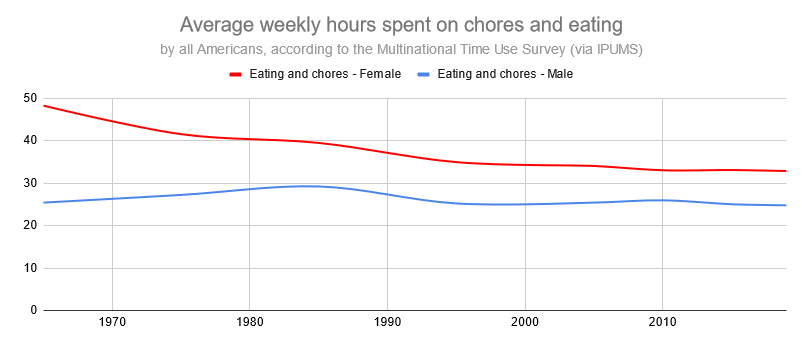
This doesn’t even factor in the greater degree of workforce participation and economic freedom among women since then. Looking at this on an overall basis, women are now spending over 15 less hours per week on chores.
But if women are spending more time working, where are men spending it?
As we can see above, men have been spending roughly the same amount of time2 on chores, with a slight rise in the 80s.
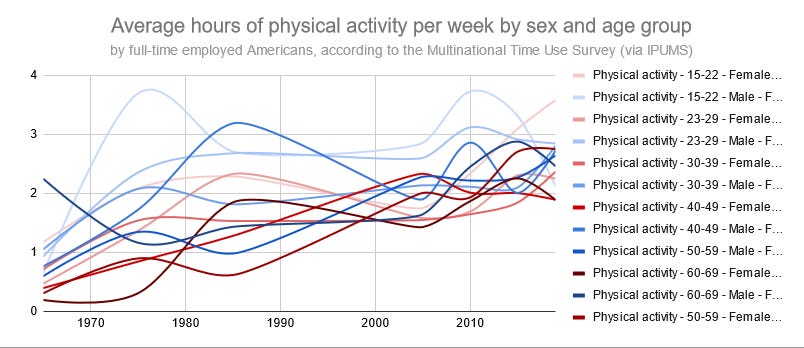
Both men and women now spend more time playing sports and doing other physical activity.
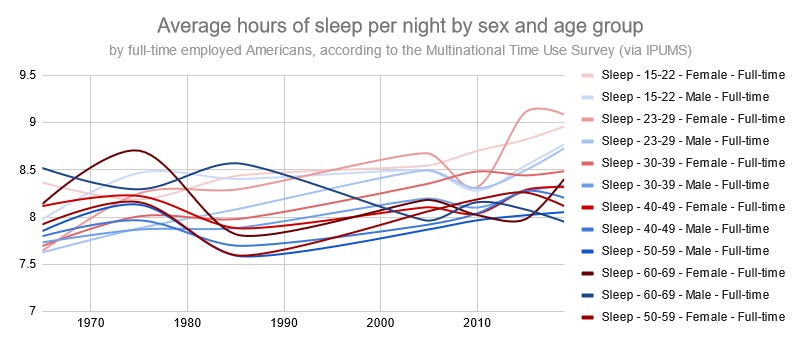
And younger men and women are getting more sleep than they used to, at least according to this survey.3
But the upward trajectory of time spent playing games by men under 40 is quite remarkable.
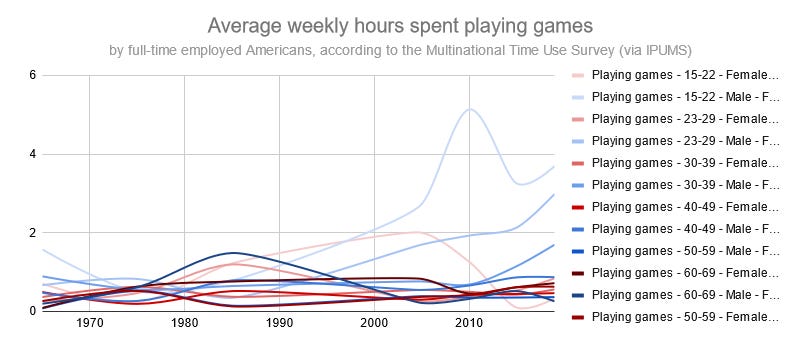
The extra ~2 hours per week4 spent gaming is enough to fill more than half of the gap in working hours between Millennial and Boomer men. And remember, this only includes people who are employed full-time!
What does this all mean?
Generational differences matter, and both changes in policy (like the Affordable Care Act) and technological advances (better video games) probably play a role in shaping people’s preferences. Just like how we had to take a closer look at an overall stagnant workweek to see there was actually a generational difference in working hours, it’s important to consider there are many stories happening behind these numbers too.
So what can we predict will happen in the year 2120?
Fewer working hours with greater equality between women and men?
And while women might fill their free time with a diverse range of activities, are men in 2120 going to be even bigger gamers than men today?
Looking forward to sharing my final piece on working hours (for now) next time. This one will be more of a global analysis, with a tentative prediction as we close out this exploration of the workweek and move on to other topics!
Note that this also includes time spent eating.
Men who work full-time do spend slightly less time on chores than in 1965, so this may be offset by the increased number of retired men and stay-at-home dads.
There is some controversy over this! There is an increasing divergence between the amount of sleep recorded on diary surveys (which ask specific bedtimes and wake-up times) vs. stylistic surveys (which ask people how many hours of sleep they typically get). This paper published by the Bureau of Labor Statistics (BLS) was a very instructive exploration of this subject.
If these numbers seem low, it should be noted that the American Time Use Survey (ATUS) doesn’t even capture the decline in men’s working hours that the Current Population Survey (CPS) does. So if the CPS data is accurate, it’s possible that that even more free time is filled playing games.